When Grapes Ripen: Case Studies of Hyperspectral Field Detection
在葡萄種植與葡萄酒釀造領域,準確監測葡萄成熟度和糖度是決定采收時機和最終酒品質量的關鍵。高光譜成像技術已被證明能夠有效檢測葡萄的成熟度、糖度(°Brix)和花青素含量,作為高光譜成像技術的專業提供商,我們期待看到這項技術在葡萄品質監測中的創新應用。
目前大多數研究都局限于實驗室環境或對單顆葡萄進行檢測。今天,我們將聚焦兩項突破性研究,展示高光譜技術如何在田間現場實現葡萄品質的非破壞性監測。
In viticulture and winemaking, accurately monitoring grape maturity and sugar content is crucial for determining optimal harvest timing and final wine quality. Hyperspectral imaging technology has proven effective in detecting grape maturity, sugar content (°Brix), and anthocyanin levels.As a professional provider of hyperspectral imaging solutions, we are excited to see innovative applications of this technology in grape quality monitoring.
Currently, most research has been limited to laboratory settings or single-berry measurements. Today, we highlight two groundbreaking studies demonstrating how hyperspectral technology enables non-destructive quality monitoring directly in the field.
『從實驗室走向田間 / From Lab to Vineyard 』
意大利團隊開發了一種基于可見光-近紅外(400-1000nm)高光譜相機的非破壞性方法,直接在葡萄園中進行13填的連續監測。他們使用偏最小二乘回歸(PLS)預測可溶性固形物含量,獲得R2=0.77的預測精度(RMSECV=0.79°Brix),并通過偏最小二乘判別分析(PLS-DA)將葡萄按成熟度(以20°Brix為界)分類,準確率達86-91%。
An Italian research team developed a non-destructive method using visible-to-near-infrared (400-1000nm) hyperspectral cameras for continuous 13-day monitoring in vineyards. Using partial least squares regression (PLS), they achieved soluble solids content (SSC) predictions with R2=0.77 (RMSECV=0.79°Brix). Through partial least squares discriminant analysis (PLS-DA), they classified grape maturity (using 20°Brix as the threshold) with 86-91% accuracy.
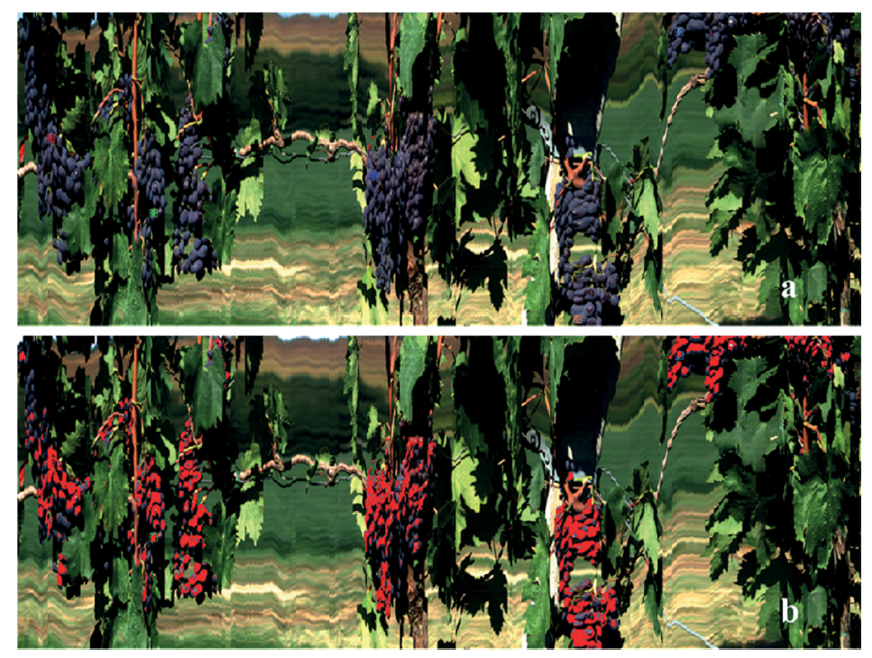
圖1 / Figure 1:
(a) RGB圖像來源于葡萄園行掃描截面的高光譜數據。 (b) 基于曼哈頓函數分類生成的ROI(紅色區域)。
(a) The RGB image is derived from hyperspectral data captured during a vineyard row scan transect.
(b) The region of interest (ROI, marked in red) was generated through classification using the Manhattan distance function.

『邊走邊測:硬件與算法的結合 / “On the Go” Monitoring: Hardware and Algorithm Synergy 』
西班牙團隊的研究則更進一步,他們開發了一套創新的"行進間"高光譜成像系統,將可見光-近紅外高光譜相機(400-1000nm、光譜分辨率2.1nm的)安裝在以5公里/小時速度移動的全地形車上。相機在車輛行進過程中連續采集數據。
為適應不同時段的光照變化,系統會智能調整幀率(40-50幀/秒),每個測量區塊平均獲取710條掃描線,總計約63.9萬個光譜像素點,。系統還配備RTK校正功能,為所有采集數據提供厘米級的地理參考。
A Spanish team advanced the technology further by developing an innovative "on-the-go" hyperspectral imaging system. They mounted a visible-to-near-infrared hyperspectral camera (400-1000nm, 2.1nm spectral resolution) on an all-terrain vehicle moving at 5 km/h, enabling continuous data acquisition during operation.
To adapt to varying light conditions, the system automatically adjusts frame rates (40-50 fps). Each measurement block captures approximately 710 scan lines, totaling ~639,000 spectral pixels. The system also integrates RTK correction for centimeter-level georeferencing of collected data.
圖2 / Figure 2:
使用安裝在全地形車(ATV)上的攝像頭以 5 公里/小時的速度進行移動高光譜成像。通過推掃式掃描,從ATV的運動中獲得整個葡萄樹冠層的圖像,并用于估計葡萄成分。
On-the-go hyperspectral imaging with a camera mounted on an all-terrain vehicle (ATV) at 5 km/h. Images of the entire vine canopy were obtained from the ATV's motion, by push-broom scanning, and used for the estimation of grape composition.

數據處理上采用了支持向量機(SVM)算法,通過五折交叉驗證,對糖度的預測達到R2=0.91(RMSE=1.358°Brix),對外部樣本的預測R2=0.92(RMSE=1.274°Brix)。對花青素濃度的預測也取得了R2=0.72(交叉驗證)和R2=0.83(外部預測)的良好結果。實現了對葡萄的可溶性固形物和花青素濃度的實時監測。
計算性能方面,在Intel Core i7處理器(16GB內存)上,處理36幅高光譜圖像平均需要5小時35分鐘,相當于每列掃描線處理時間約0.79秒。而使用訓練好的SVM模型預測單個樣本僅需0.05秒,展現了良好的實用性能。
For data processing, the team employed support vector machine (SVM) algorithms. Through five-fold cross-validation, sugar content predictions reached R2=0.91 (RMSE=1.358°Brix), with external validation achieving R2=0.92 (RMSE=1.274°Brix). Anthocyanin concentration predictions also showed strong results: R2=0.72 (cross-validation) and R2=0.83 (external validation), enabling real-time monitoring of soluble solids and anthocyanins.
In terms of computational performance, processing 36 hyperspectral images on an Intel Core i7 processor (16GB RAM) averaged 5 hours and 35 minutes (~0.79 seconds per scan line). Trained SVM models required only 0.05 seconds per sample prediction, demonstrating practical usability.
圖3 / Figure 3:
(a)基于RGB通道的高光譜圖像(為便于說明,對直方圖進行了歸一化)。 (b)像素光譜與葡萄標準光譜的R2值相關矩陣(應用σ=1.0高斯平滑核函數)。 (c)基于R2≥0.75閾值的葡萄像素分割結果圖。
(a) Hyperspectral image from a block in red, green and blue (RGB) channels (histogram normalised for the sake of illustration). (b) Correlation matrix with R2 values between the pixel spectrum and a grape reference spectrum. A Gaussian smoothing was applied with σ?=?1.0. (c) Image with segmented grape pixels (pixels in (b) whose R2?≥?0.75). All the images were stretched in the horizontal axis for aesthetic purposes.

圖 4/ Figure 4:
可溶性固體物模型的交叉驗證和預測結果.
Regression plot for (a) fivefold cross validation (R2?=?0.91; RMSE?=?1.358) and (b) prediction results (R2?=?0.92; RMSE?=?1.274) for the TSS models.

圖5 / Figure 5:
漿果花青素濃度的交叉驗證和預測模型的回歸圖.
Regression plot for (a) fivefold cross validation (R2?=?0.72; RMSE?=?0.282) and (b) prediction results (R2?=?0.83; RMSE?=?0.211) for the anthocyanin concentration models.

『挑戰與未來展望 / Challenges and Future Outlook 』
盡管仍需解決環境干擾、數據處理速度等問題,這兩項研究證實了高光譜技術在田間應用的可行性。
我們期待與更多農業機構合作,提供專業的高光譜硬件解決方案。我們的設備能夠為客戶的研發團隊提供高質量的原始數據,兼容多種數據格式。隨著技術優化,這項技術有望成為智慧葡萄園的標準配置,為葡萄和葡萄酒產業帶來精細化管理的新時代。
While challenges like environmental interference and processing speed remain, these studies confirm hyperspectral technology's field applicability.
We look forward to collaborating with agricultural institutions to provide professional hyperspectral hardware solutions. Our equipment delivers high-quality raw data in multiple compatible formats for research teams. As the technology evolves, it is poised to become a standard tool for smart vineyards, ushering in a new era of precision management for grape and wine production.
案例來源 / Source:
1. Benelli, A., Cevoli, C., Ragni, L., & Fabbri, A. (2022). Reprint of: In-field and non-destructive monitoring of grapes maturity by hyperspectral imaging. Biosystems Engineering, 223(Part B), 200-208.
2. Gutiérrez, S., Tardaguila, J., Fernández-Novales, J., & Diago, M. P. (2018). On-the-go hyperspectral imaging for the in-field estimation of grape berry soluble solids and anthocyanin concentration. Australian Journal of Grape and Wine Research, 24(2), 127-133.
相關產品
免責聲明
- 凡本網注明“來源:化工儀器網”的所有作品,均為浙江興旺寶明通網絡有限公司-化工儀器網合法擁有版權或有權使用的作品,未經本網授權不得轉載、摘編或利用其它方式使用上述作品。已經本網授權使用作品的,應在授權范圍內使用,并注明“來源:化工儀器網”。違反上述聲明者,本網將追究其相關法律責任。
- 本網轉載并注明自其他來源(非化工儀器網)的作品,目的在于傳遞更多信息,并不代表本網贊同其觀點和對其真實性負責,不承擔此類作品侵權行為的直接責任及連帶責任。其他媒體、網站或個人從本網轉載時,必須保留本網注明的作品第一來源,并自負版權等法律責任。
- 如涉及作品內容、版權等問題,請在作品發表之日起一周內與本網聯系,否則視為放棄相關權利。
 手機版
手機版 化工儀器網手機版
 化工儀器網小程序
 官方微信
官方微信 公眾號:chem17
 掃碼關注視頻號


 采購中心
采購中心